Research Question
The aim of this project is to investigate the impact of hurricanes on the annual percentage of GDP growth in The Bahamas. Growing up in The Bahamas, I have witnessed first hand the devastating impacts of hurricanes on livelihoods throughout the country and have been an active participant in recovery efforts every time my island was struck. Natural disasters have massive economic costs and take a deep toll on growth prospects because reconstruction costs monopolize already scarce resources for health, education, and social spending, especially in developing countries (Ötker & Srinivasan, 2018). There is existing research on the impact of hurricanes on GDP growth in the United States but this project will look specifically at The Bahamas. With the global changing climate and the continual impact of stronger hurricanes on Caribbean countries, answering this question can have important implications for the future of small island developing states like The Bahamas.
Data Collection and Tidying
GDP Growth Data
The data for annual percentage of GDP Growth was collected from The World Bank Open Data Repository (World Bank, 2021). This data covers annual percentage of GDP growth from 1961 to present for The Bahamas. The metadata containing information about calculations and sampling strategy can be found here.
Show code
gdp_growth <- read_csv(here("_posts", "2021-11-24-hurricanes-and-gdp-growth-in-the-bahamas", "final_proj_data", "bah_yearly_gdp_growth.csv")) %>%
  rename("country_name" = "Country Name") %>%
  filter(country_name == "Bahamas, The") %>%
  select(-"Indicator Name") %>%
  pivot_longer(cols = 2:62,
               names_to = "year",
               values_to = "gdp_growth") %>%
  mutate(year = as.numeric(year))
Show code
ggplot(data = gdp_growth, aes(x = year, y = gdp_growth)) +
  geom_line(color = "lightblue") +
  geom_point(color = "blue") +
  labs(x = "Year",
       y = "Annual % GDP Growth",
       title = "Yearly Percentage of GDP Growth for The Bahamas") +
  theme_classic() +
  theme(plot.title = element_text(hjust = 0.5))
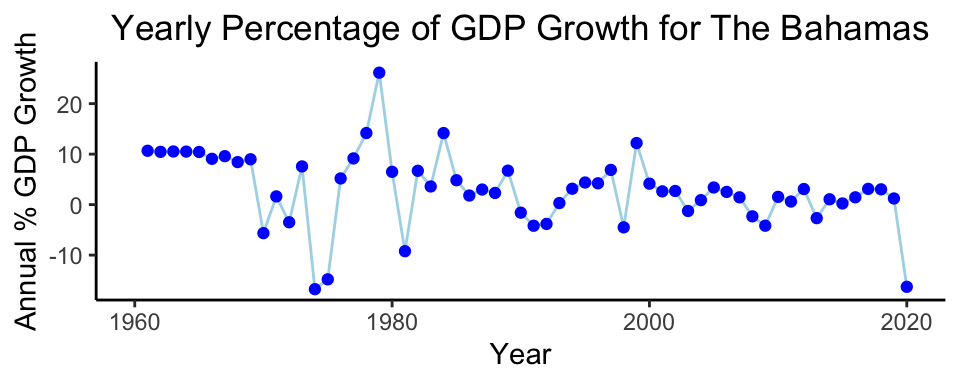
Figure 1: Yearly Pecentage of GDP Growth for The Bahamas from 1960 to 2020 shows a slight downward trend with some years not following the general trend in the form of a large spike in either the positive or negative direction.
Hurricane Data
The data on hurricanes in The Bahamas was collected from the National Hurricane Center’s Data Archive (National Hurricane Center, 2021a). This dataset did not exist in csv format, so I looked through the yearly reports from 1960 to present and recorded all of the storms that impacted The Bahamas. I made note of the year each storm occurred, the name of the storm, the intensity and the number of islands in The Bahamas that were impacted by each storm.
In creation of this dataset, I recorded storm intensity from 1 to 6, with 1 being Tropical Storms and 6 being a category 5 hurricane. The Saffir-Simpson Wind Scale considers a tropical storm anything with winds below 74mph (National Hurricane Center, 2021b), but I know from personal experience that these storms can still have damaging impacts on countries so I wanted to ensure they were included in the data to be analyzed for this question.
Show code
storms <- read_csv(here("_posts", "2021-11-24-hurricanes-and-gdp-growth-in-the-bahamas", "final_proj_data", "bahamas_hurricanes.csv"))

yr_storms <- storms %>%
  group_by(year) %>%
  summarize(number = n(),
            avg_strength = mean(category)) %>%
  add_row(year = c(1962, 1964, 1967, 1968, 1969, 1971,
                   1974, 1975, 1976, 1977, 1978, 1980,
                   1982, 1983, 1986, 1989, 1990, 1993,
                   1994, 1997, 2000, 2009), number = 0, avg_strength = 0) %>%
  arrange(year)

yearly <- ggplot(data = yr_storms, aes(x = year, y = number)) +
  geom_col(fill = "lightblue") +
  labs(x = "Year",
       y = "Number",
       title = "Yearly Number of Storms to Impact the Bahamas") +
  theme_minimal() +
  theme(plot.title = element_text(hjust = 0.5))

yearly
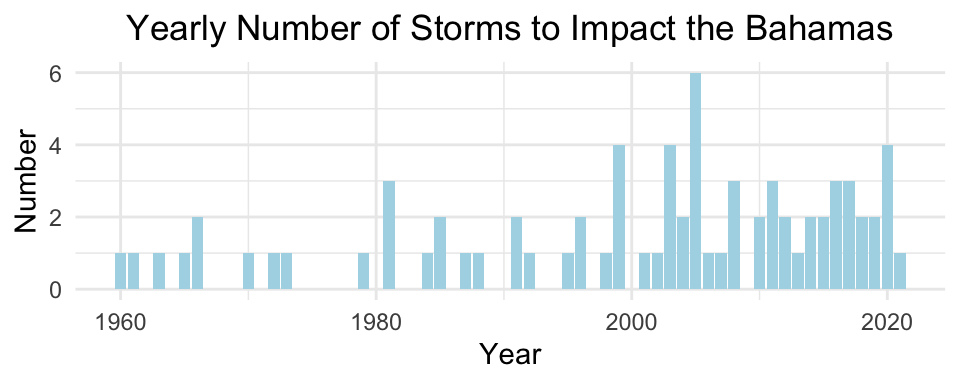
Figure 2: The yearly number of storms to impact The Bahamas from 1960-2020 has fluctuated between 0 and 6 storms.
Show code
ggsave("yearly_storms.jpg", width = 6, height = 4)
Analysis
Plan
For this analysis I am going to first look at a linear regression of the impact of yearly number of hurricanes on annual percentage of GDP growth. I decided to use linear regression to first see if there was an immediate effect of hurricanes on percentage of GDP growth.
Because I have data on the yearly number of hurricanes, I have the capability of looking at the lagged effect by year. I am interested in this because the hurricane season is June 1st to November 30th, so the impact of a late season storm might not be seen immediately. Additionally, the rebuilding process after a storm is slow so it can take a while for the progress to be seen. This means I will look at the number of hurricanes in the current year, and with a one and two year lag to see if there is a statistically significant impact of these. I will also look at the potential of a lagged dependent variable. I will use an auto correlation function to determine if the model is biased or inefficient using the dwtest().
The biggest limitation in answering my research question is the known fact that more than the impact of hurricanes affect the annual GDP growth of The Bahamas so there is a likely chance that my results will be inconclusive and my OLS assumptions will be violated.
Results
Test 1
The first linear regression model is \(gdpgrowth_i = \beta_0 + \beta_1 numstorms_i + u_i\). This tests the impact of number of storms on annual percentage of GDP growth.
Show code
gdp_num_strength <- lm(gdp_growth ~ num_yr0, data = hgdp) %>%
  summary() %>%
  xtable() %>%
  kable(digits = 3,
        caption = "Linear Regression of Number of Hurricanes on Annual Percentage GDP Growth") %>%
  kable_styling(latex_options = "HOLD_position")

mod <- lm(gdp_growth ~ num_yr0, data = hgdp)
gdp_num_strength
| Estimate | Std. Error | t value | Pr(>|t|) | |
|---|---|---|---|---|
| (Intercept) | 4.181 | 1.272 | 3.288 | 0.002 |
| num_yr0 | -1.032 | 0.713 | -1.448 | 0.153 |
This linear regression tells us that the annual percentage of GDP growth in The Bahamas without the impact of Hurricanes is 4.18. With an increase in number of hurricanes per year by 1, the annual percentage of GDP Growth decreases by -1.03. The p-value for this linear regression is greater than 0.05 so we fail to reject the null hypothesis that there is no impact of the number hurricanes on GDP growth.
Show code
yr0 <- hgdp %>%
  ggplot(aes(y = gdp_growth, x = num_yr0)) +
  geom_point() +
  stat_smooth(method = "lm", se = FALSE) +
  labs(x = "Average Number of Storms",
       y = "Annual % GDP Growth",
       title = "Regression of Yearly GDP Growth and Number of Storms") +
  theme_minimal()

yr0
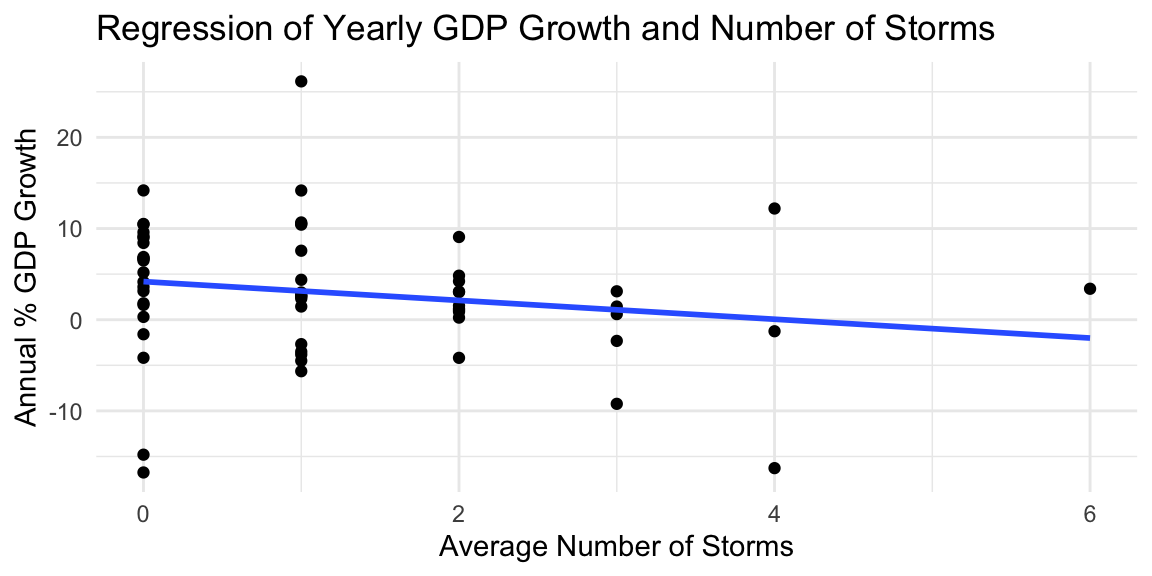
Figure 3: Linear regression of yearly percentage of GDP Growth and the number of storms that impacted The Bahamas shows a negative correlation.
Test 2
The second linear regression I tested was the impact of a one year and two year lag in number of storms on the annual percentage of GDP growth.
\(gdpgrowth_t = \beta_0 + \beta_1 numstorms_t + \beta_1 numstorms_{t-1} + \beta_1 numstorms_{t-2} + u_t\)
Show code
gdp <- ts(hgdp$gdp_growth, start=1960)
yr0<-ts(hgdp$num_yr0,start=1960)

year_lag_mod <- dynlm(gdp ~ L(yr0, 0) + L(yr0, 1) + L(yr0, 2))
year_lag_mod %>%
  summary() %>%
  xtable() %>%
  kable(digits = 3,
        caption = "Multiple Linear Regression of Number of Hurricanes on Annual Percentage GDP Growth with a Two Year Lag Effect") %>%
  kable_styling(latex_options = "HOLD_position")
| Estimate | Std. Error | t value | Pr(>|t|) | |
|---|---|---|---|---|
| (Intercept) | 5.249 | 1.576 | 3.331 | 0.002 |
| L(yr0, 0) | -0.724 | 0.739 | -0.979 | 0.332 |
| L(yr0, 1) | -0.285 | 0.758 | -0.376 | 0.709 |
| L(yr0, 2) | -1.075 | 0.770 | -1.396 | 0.168 |
Show code
year_lag_mod_test <- dwtest(year_lag_mod)
The p-values in this linear regression were not significant enough in any of the scenarios to reject the null hypothesis, so they all failed to reject. The p-value for the two year lag was the lowest so it had more power but was still not lower the 0.05 significance level. Also, the Adjusted R-squared value was 0.02 which means the explanatory power from the number of storms is very low, only 2%.
When running the dwtest() on the year lag model, there was a p-value of 0.0026 which is less than 0.05. This means that we can reject the null hypothesis and conclude that the residuals in the regression are auto-correlated with the explanatory variables. This means the errors are correlated which makes OLS biased.
Show code
yr0 <- hgdp %>%
  ggplot(aes(y = gdp_growth, x = num_yr0)) +
  geom_point() +
  stat_smooth(method = "lm", se = FALSE) +
  labs(x = "Average Number of Storms",
       y = "Annual % GDP Growth",
       title ="Year 0") +
  theme_minimal()

yr1 <- hgdp %>%
  ggplot(aes(y = gdp_growth, x = num_yr1)) +
  geom_point() +
  stat_smooth(method = "lm", se = FALSE) +
  labs(x = "Average Number of Storms",
       y = "Annual % GDP Growth",
       title = "Lag Year 1") +
  theme_minimal()

yr2 <- hgdp %>%
  ggplot(aes(y = gdp_growth, x = num_yr2)) +
  geom_point() +
  stat_smooth(method = "lm", se = FALSE) +
  labs(x = "Average Number of Storms",
       y = "Annual % GDP Growth",
       title = "Lag Year 2") +
  theme_minimal()


yr0 | yr1 | yr2
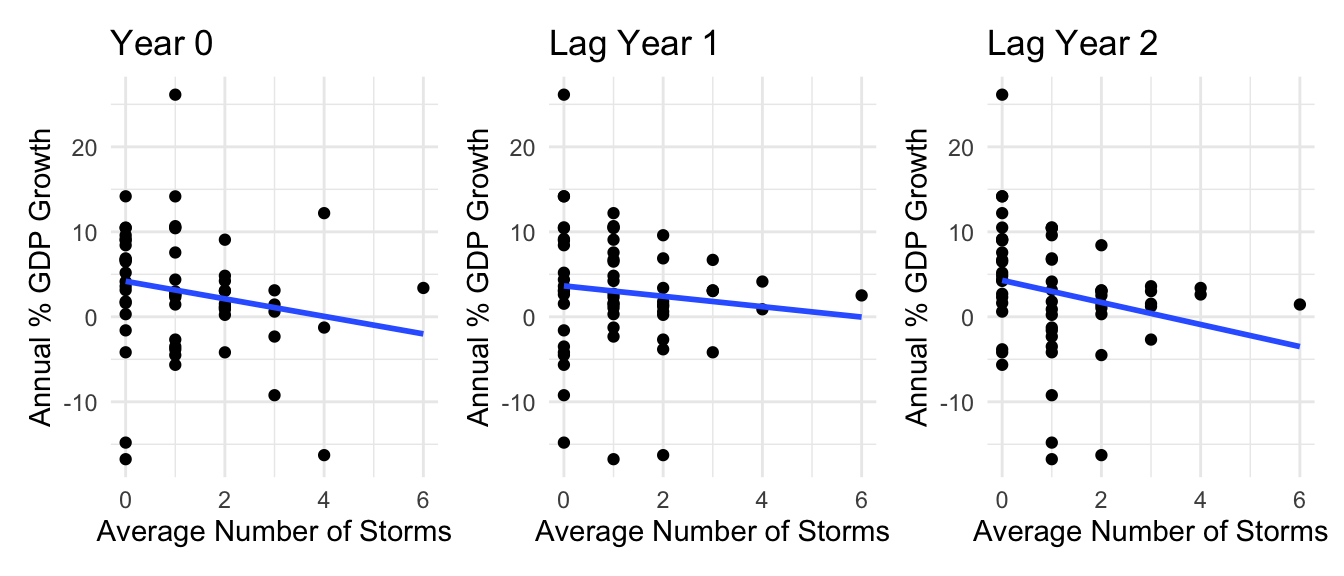
Figure 4: Linear regression of yearly percentage of GDP Growth and the number of storms that impacted The Bahamas shows a negative correlation. The largest negative correlation is seen in the graph with a 2 year lag effect
Test 3
The third regression I completed for my time series OLS analysis was observing the impact of a one and two year lag in number of storms combined with the impact of past percentage of GDP growth on current percentage of GDP growth.
\[gdpgrowth_t = \beta_0 + \beta_1 numstorms_t + \beta_1 gdpgrowth_{t-1} + \beta_1 numstorms_{t-1} + \beta_1 gdpgrowth_{t-2} + \beta_1 numstorms_{t-2} + u_t\].
Show code
gdp <- ts(hgdp$gdp_growth, start=1960)
yr0<-ts(hgdp$num_yr0,start=1960)
year_gdp_lag_mod <- dynlm(gdp ~ L(yr0, 0) + L(gdp, 1) + L(yr0, 1) + L(gdp, 2) + L(yr0, 2))
year_gdp_lag_mod %>%
  summary() %>%
  xtable() %>%
  kable(digits = 3,
        caption = "Multiple Linear Regression of Number of Hurricanes on Annual Percentage GDP Growth with a Year Lag and a GDP Lag") %>%
  kable_styling(latex_options = "HOLD_position")
| Estimate | Std. Error | t value | Pr(>|t|) | |
|---|---|---|---|---|
| (Intercept) | 3.643 | 1.691 | 2.154 | 0.036 |
| L(yr0, 0) | -0.457 | 0.727 | -0.629 | 0.532 |
| L(gdp, 1) | 0.345 | 0.145 | 2.374 | 0.021 |
| L(yr0, 1) | -0.173 | 0.738 | -0.235 | 0.815 |
| L(gdp, 2) | -0.034 | 0.144 | -0.234 | 0.816 |
| L(yr0, 2) | -1.017 | 0.747 | -1.362 | 0.179 |
When interpreting the p-values in this multiple linear regression, there is a p-value of 0.021 which is less than 0.05 for a 1 year lag in GDP which means this rejects the null hypothesis that there is no relationship between GDP growth in the current year and GDP growth in the previous. The remainder of the variables in this regression model are not statistically significant and they failed to reject the null hypothesis.
Conclusion and Next Steps
Based on the findings of my complete analysis, the impact of hurricanes on the annual percentage of GDP growth can not be determined simply by the explanatory variables chosen. When looking at the size of the p-values for each of the linear regressions, it is clear that further analysis needs to be done to determine the impact of hurricanes on GDP growth.
In this further analysis, I would look at other contributing factors to GDP growth in The Bahamas and try to identify some of the possible omitted variable bias. The link between annual percentage of GDP growth and storm intensity and population impacted would be analyzed. Because The Bahamas is an archipelago of 17 major inhabited islands, often hurricanes will only impact a few of them. Larger islands have more infrastructure so damages can be more costly. Looking at the number of islands and the population impacted by a hurricane might lead to a more definitive answer about the impact of hurricanes on the annual percentage of GDP growth. In this further analysis, I can also look at the cost of damages of each storm and compare that to the annual percentage of GDP growth. This would be another good metric for determining the impact of storms as they can both be mesured on a US dollar scale. Finally, I would examine how to separate the impact of Covid-19 on annual percentage of GDP growth. I considered removing 2020 from the datasets because there was a very large decrease in percentage GDP growth. However in 2019, The Bahamas was hit with the worst hurricane on record. Dorian destroyed two islands and resulted in 3.4 billion dollars in damages, over 25% of The Bahamas’ GDP (Inter American Development Bank, 2019). As shown in my second hypothesis test, there is a lag effect on the impact on GDP. Removing the years following the impact of Hurricane Dorian would cause inaccuracies in the study.
Github
The repository containing all of the code and data for this analysis can be found here.
References
Inter American Development Bank. (2019, November 15). Damages and other impacts on Bahamas by Hurricane Dorian estimated at $3.4 billion: Report | IADB. https://www.iadb.org/en/news/damages-and-other-impacts-bahamas-hurricane-dorian-estimated-34-billion-report
National Hurricane Center. (2021a). NHC Data Archive. https://www.nhc.noaa.gov/data/
National Hurricane Center. (2021b, May). Saffir-Simpson Hurricane Wind Scale. https://www.nhc.noaa.gov/aboutsshws.php
Ötker, İ., & Srinivasan, K. (2018). For the Caribbean, building resilience is a matter of survival. Finance and Development, 55(1), 4.
World Bank. (2021). GDP growth (annual %)—Bahamas, The | Data. https://data.worldbank.org/indicator/NY.GDP.MKTP.KD.ZG?locations=BS