Exploring Palmer Penguins
This is a graph using ggplot to display the flipper length and body mass relation of the palmer penguins dataset.
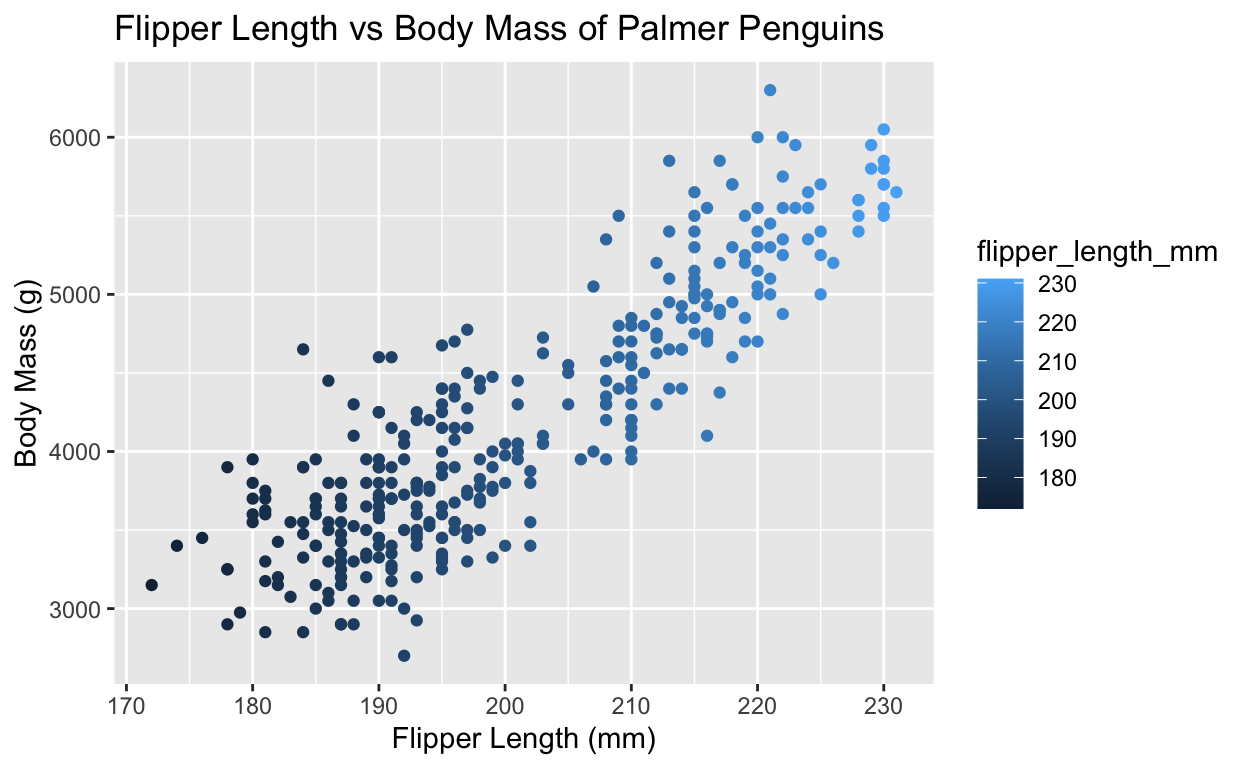
This blog post has graphs from the palmer penguins dataset.
This is a graph using ggplot to display the flipper length and body mass relation of the palmer penguins dataset.
For attribution, please cite this work as
Cartwright (2021, Aug. 10). Paloma Cartwright (she/her): Using `ggplot` to Explore Palmer Penguins Datasets. Retrieved from palomacartwright.github.io/posts/2021-08-10-function/
BibTeX citation
@misc{cartwright2021ggplotandpalmerpenguins,
  author = {Cartwright, Paloma},
  title = {Paloma Cartwright (she/her): Using `ggplot` to Explore Palmer Penguins Datasets},
  url = {palomacartwright.github.io/posts/2021-08-10-function/},
  year = {2021}
}