Using GGally and ggplot to Explore the Diamonds data set
Using ggplot
Creating a Scatter Plot
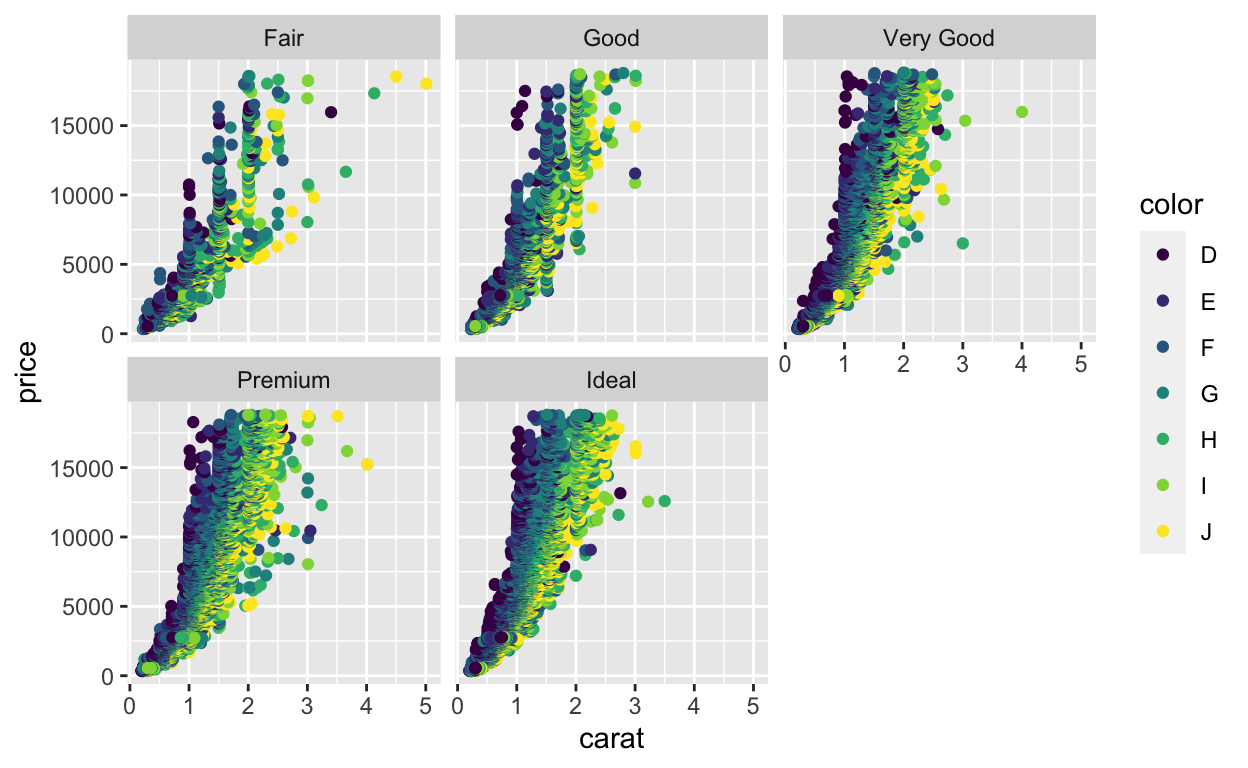
Creating a scatter plot of carat versus price of the diamonds data set.
Generally, as the carats increase, the price of the diamonds also increase.
Creating a Histogram
Creating a histogram of the carats of diamonds in the dataset
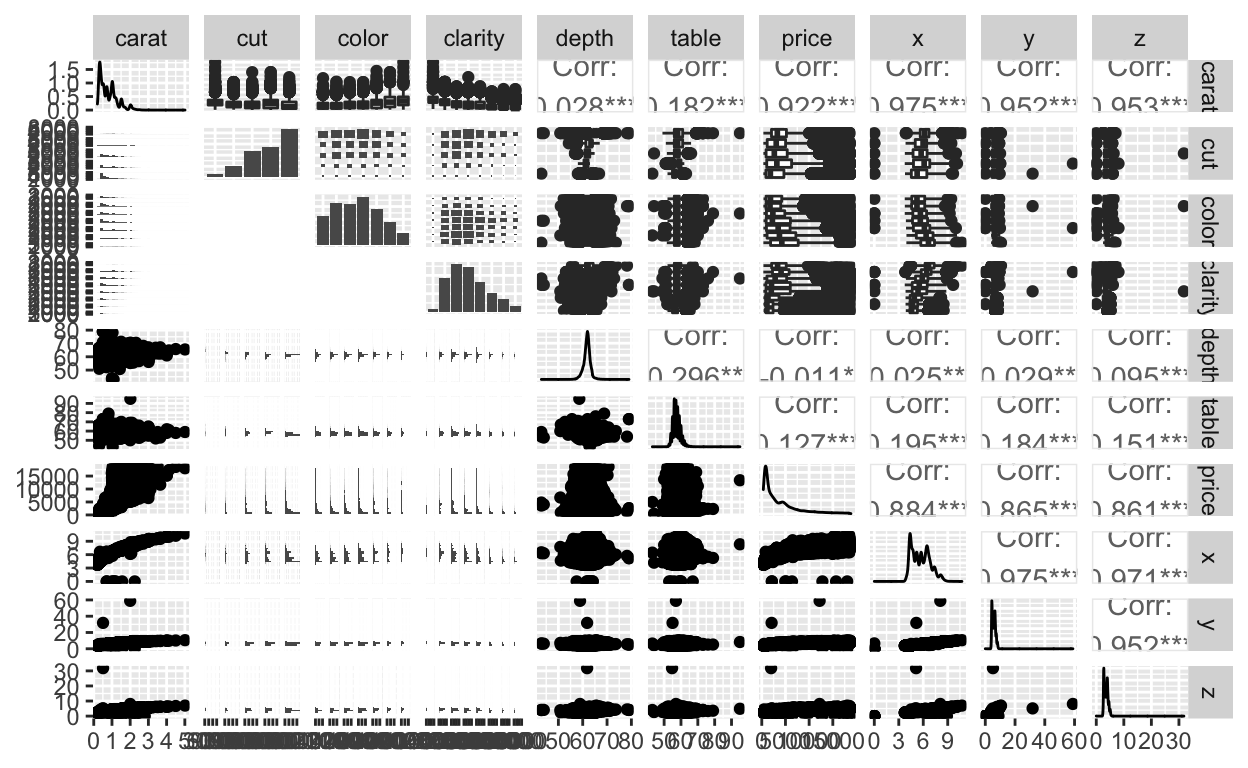
Using GGally
This outputs a really ridiculous set of graphs, but that is the purpose of the ggpairs function.
Citation
For attribution, please cite this work as
Cartwright (2021, Aug. 10). Paloma Cartwright (she/her): Exploring the Diamonds Dataset. Retrieved from palomacartwright.github.io/posts/2021-08-10-diamondsdataset/
BibTeX citation
@misc{cartwright2021exploring,
  author = {Cartwright, Paloma},
  title = {Paloma Cartwright (she/her): Exploring the Diamonds Dataset},
  url = {palomacartwright.github.io/posts/2021-08-10-diamondsdataset/},
  year = {2021}
}